Candlesticks
Financial analysis comes down to two things:
- Reading charts
- Reading news
Types of Charts
- There are many types of charts, whereby candlestick charts are the most popular ones.
- Such a chart consists of many filled and empty (red and green) candle sticks lined up one after another
- Each candle gives you detailed information about the price movement within a specified time interval.
- In fact, Japanese Candlesticks are the best way to visualize the ups and downs of a price, so that you can spot potential opportunities to buy or sell.
Japanese Candlesticks
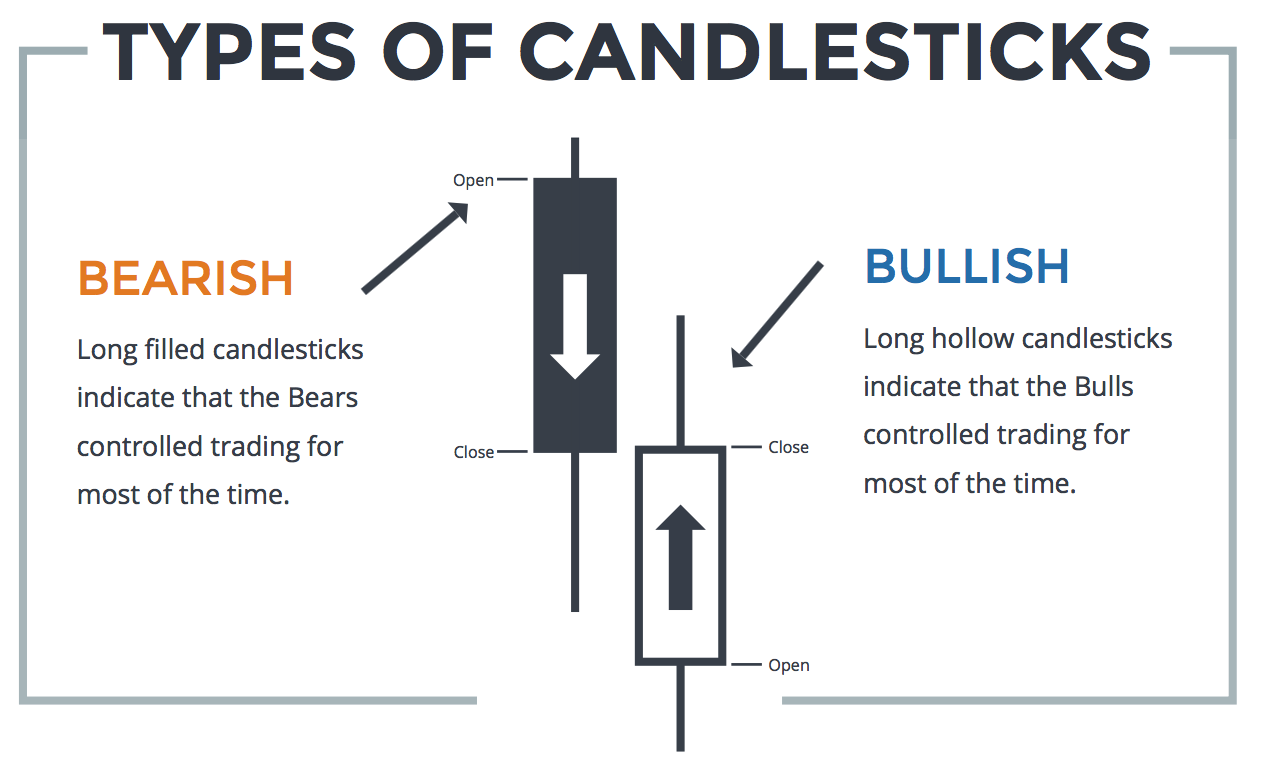
- Every candlestick consists of a body with one or two tails called shadows sticking out of it
- The body indicates the range between the open and close prices for a specific time frame and the shadows represent the highest and lowest price levels reached for the set interval
- Japanese Candlestick charts are easy to read
- A filled (red) candle shows that the price is going down
- An empty (green) one represents an increase in price
- If you’re looking at a ten minute chart, each candle represents a ten minute time interval
- We see an empty (green) candle when the open price is lower than the close price
- If the price closes lower than it opened then the candle is filled (red)

Kinds of Signals
- Candlestick charts are excellent for spotting market turning points
- By looking at the patterns that candles create you can often guess that a certain market is about to continue in its current direction or reverse it
- Patterns that show that the market could change direction are called Reversal Patterns
- Bearish: indicate the change from an up trend to a down trend and should be perceived as a signal to sell
- Bullish: show that a price which has been decreasing is likely to start going up and we should buy
- The relationship between the open and close is considered vital information and forms the essence of candlesticks.
- Hollow candlesticks, where the close is greater than the open, indicate buying pressure.
- Filled candlesticks, where the close is less than the open , indicate selling pressure.
Bullish Patterns
- Bullish candlesticks indicate the market is moving in an upward trend.
- Once you have your bullish candle, take a look at the body.
- The bigger the body, the bigger the upward price movement for that specific point in time.
- Ideally, you want to identify a full-bodied candlestick with small wicks.
- The small wicks signify the highest and lowest price.
- The smaller the wick, the less volatile the price movement during that time period.
- Small bodies with large wicks mean indecision and fighting for control.
- Large bodies with small wicks means one group is in control of the market for that particular time period.
Bullish Shooting Star
When you see this: BUY in the direction of the trend at the opening of the next candle or when it meets the criteria of the Bullish Shooting Star.
Bullish Engulfing
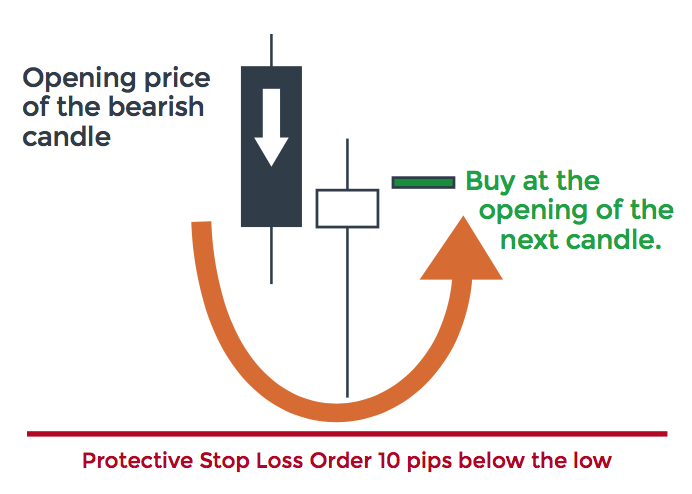
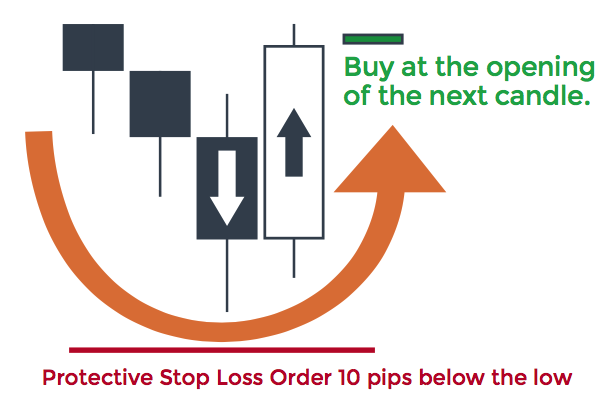
- The Bullish Engulfing consists of a filled candle followed by an empty one which fully engulfs the filled one
- The pattern is an indication for a market turning point
- In simple words: “It’s likely that the market will start going up and you can buy”
- The indication is even stronger if the empty candlestick engulfs two or three filled candles
- After the Bullish Engulfing Candle appears in the direction of the trend, BUY at the opening of the next candle with a protective stoploss order approximately 10 pips beyond the lows of the wicks.
Hammer
- The name of this candle is pretty much self explanatory
- You’ll recognise the hammer by its short body, lower shadow that is about two or three times the length of the body, and a shorter upper shadow or now shadow at all
- The hammer is usually a clear indication of a declining price reversing its direction that’s starting to go up so you can buy, but just to be safe you could always wait for additional confirmation
- Such confirmation is an empty candle closing above the opening of the hammer for example
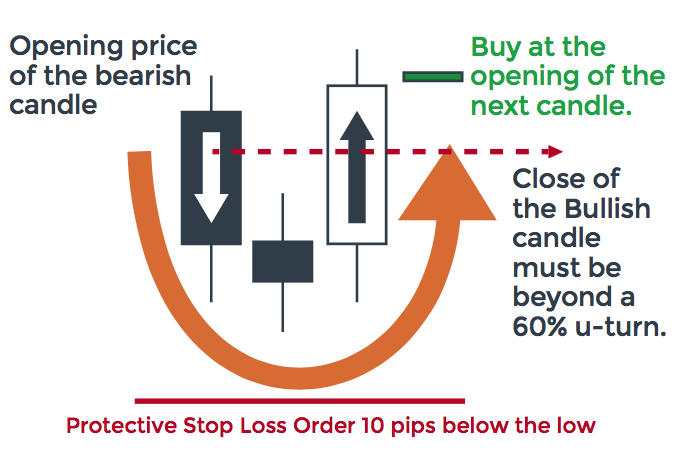
Morning Doji Star
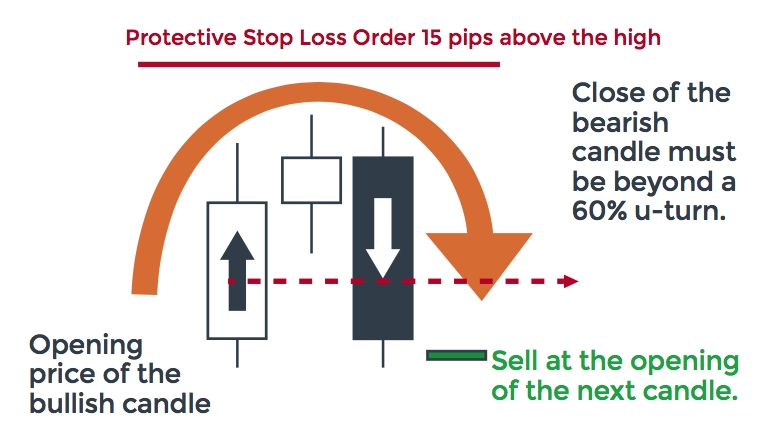
- This pattern appears when there is a slight market movement and consists of three candles: a filled one, followed by a Doji, followed by an empty candle closing beyond the middle of the first candle
- If the empty candle is longer than the filled one the signal is even more reliable
- Spotting the morning Doji Star is a signal to buy
- When you see this: BUY in the direction of the trend at the opening of the next candle or when it meets the criteria of the Bullish Morning Star.
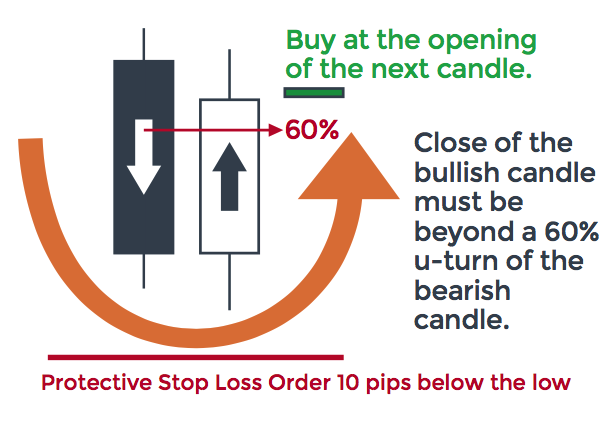
Piercing Line
When you see this: BUY in the direction of the trend at the opening of the next candle or when it meets the criteria of the Bullish Piercing Line.
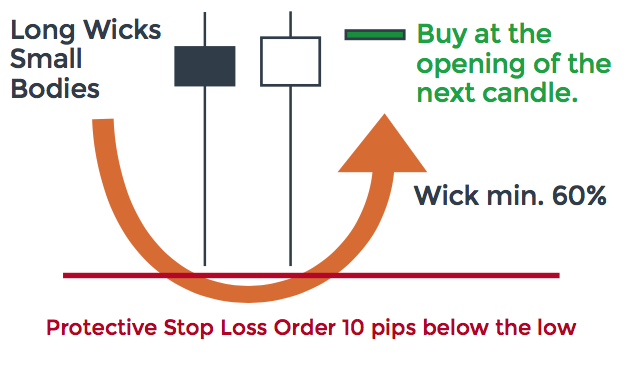
Tweezer Bottom
When you see this: BUY in the direction of the trend at the opening of the next candle or when it meets the criteria of the Tweezer Bottom.
Bearish Patterns
- Bearish candlesticks indicate the market is moving in a downward trend.
Once you spot a bearish candlestick, make sure it follows the same body-to-wick ratio as with the bullish candlesticks.
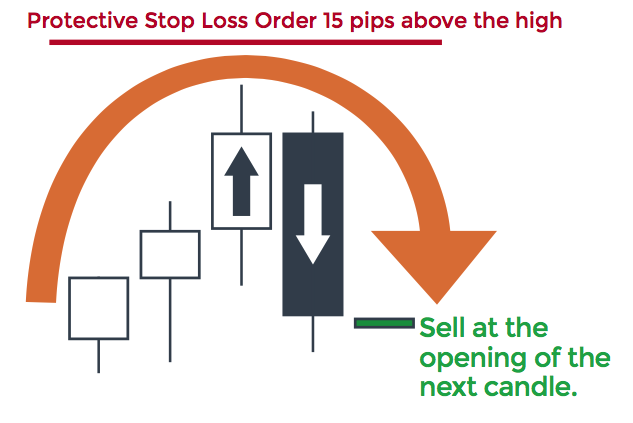
Bearish Engulfing
This patterns is the opposite of Bullish Engulfing
An empty candle is completely engulfed by a following filled candle
When you spot it you can sell as the sellers on the market have possibly managed to overpower the buyers and the price direction could reverse
When you see this: After the Engulfing Bearish Candle appears in the direction of the trend, SELL at the opening of the next candle with a protective stop loss order approximately 15 pips beyond the HIGHS of the wicks.
Dark Cloud Cover
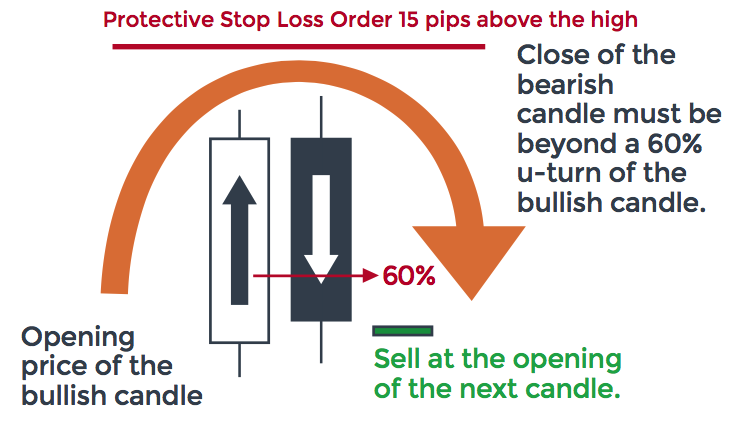
- The Dark Cloud Cover appears before the price drops down
- A long empty candle is followed by a filled one that opens at a new high and closes below the middle of the empty candle
- Keep in mind that when trading currencies a second candle opening at a new high is rare, so the filled candle usually opens at the close level of the empty one
- Once you see this pattern you can go ahead and sell, or you can wait for another smaller filled candle to form and confirm the Dark Cloud Cover
- When you see this: SELL in the direction of the tend at the opening of the next candle or when it meets the criteria of the Bearish Dark Cloud Cover formation.
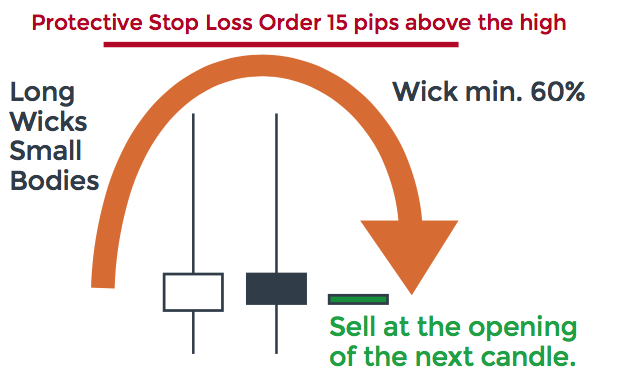
Bearish Shooting Star
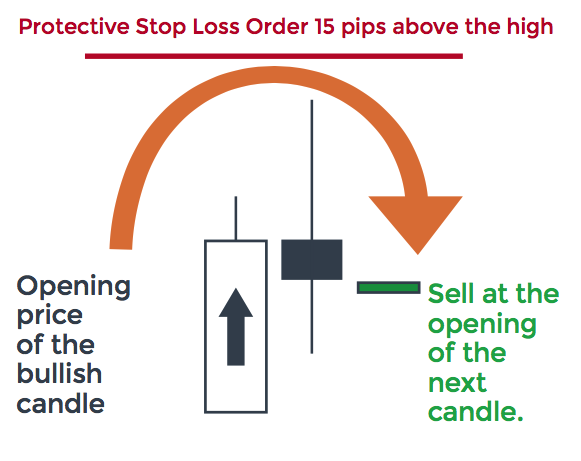
- The Bearish Shooting Star is a filled candle stick with a small body, long upper shadow and a short lower one
- When it appears at the end of an up-trend it shows you that you can sell, since the price which has been rising up to that point may start falling instead
- When you see this: SELL in the direction of the trend at the opening of the next candle or when it meets the criteria of the Bearish Shooting Star.
Evening Star
When you see this: SELL in the direction of the trend at the opening of the next candle or when it meets the criteria of the Bearish Evening Star.
Tweezer Top
When you see this: After you have two candles that have met the criteria of a Tweezer Top, SELL at the opening of the next candle with a protective stoploss order approximately 15 pips beyond the highs of the wicks.
