Head and Shoulders
Introduction
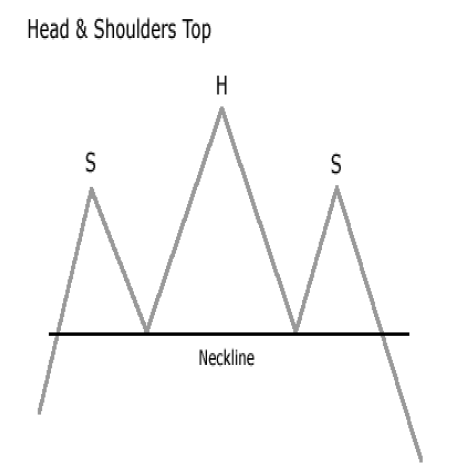
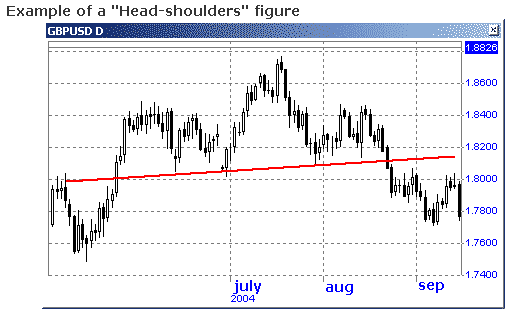
A pattern resembling two peaks (the shoulders) with a higher peak between the two shoulders (the head). The neckline, or the bottom boundary that both shoulders reach, is regarded as a key point traders can use to enter/exit positions.
Four Head and Shoulders Phases
This is probably the most famous of all chart patterns, but not always the most reliable. When it works it will always be seen as a reversal pattern and consists of four phases.
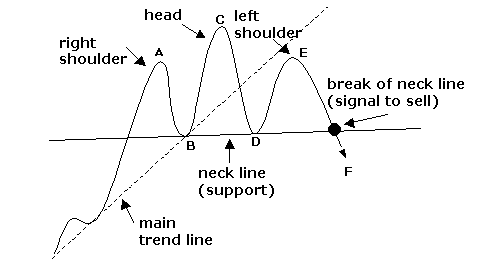
The first phase is the formation of a small peak (point A which is the left shoulder), retraces and then is followed by more aggressive buying to create the head, which eventually retraces and tests the support (know as the neckline), followed by another attempt at a rally, which does not produce a peak as high as the head (point C). This is then followed by another test of the neckline.
Points B, D - local minima.
This particular pattern is seen as a reversal, in which a break of the neckline is expected and the move should be in the amount equivalent from head to neckline.
The unreliability of this move result from the fact that the final test of the neckline does not always result in a break and the move continues in the same direction as before. This means a definite break of the neckline (say 15-25 pips) should be seen before action is taken. Based on momentum, the momentum should be higher during the formation of the left shoulder than the right shoulder to confirm that this pattern is taking place and that buying pressure is decreasing.
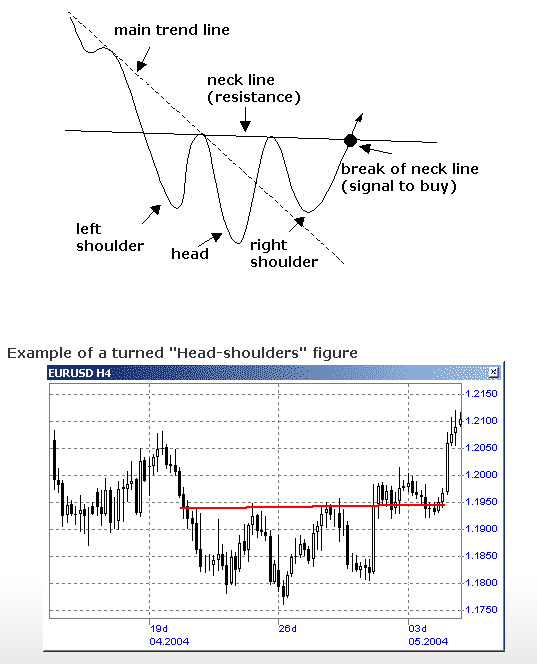
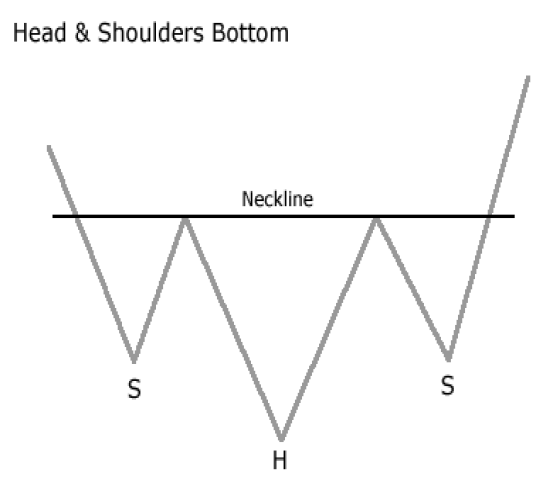
Turned Head & Shoulders
The turned figure “Head-shoulders” does not require the description as its development is similar about accuracy up to on the contrary.