Triangles
Introduction
- Triangles usually form over a period between three days to three weeks.
- They take longer to form than flags or pennants and will often form after a major price move.
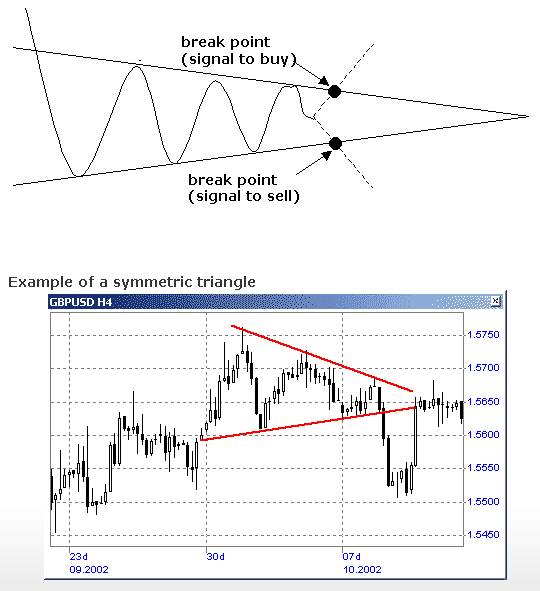
- When a pattern develops that displays a series of peaks that are progressively lower and a series of higher troughs, it generally indicates that indecision exists in the market.
- Usually, the price will break out of the pattern with an equal amount to the base of the triangle and in the same direction as the original trend. Just like with symmetrical triangles, the move from the apex to the equal base of the triangle can be expected.
- The two trend lines should indicate at least four points of contact before a break out can occur.
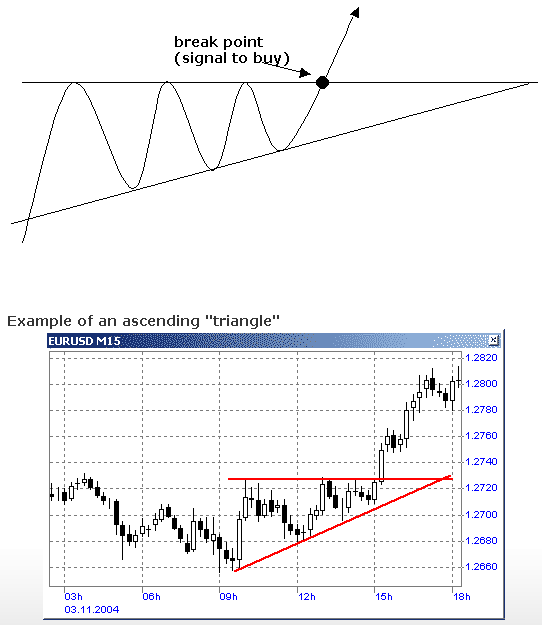
- In these types of patterns, with a horizontal trend line, the direction the break out will follow can be predicted.
- For example, buyers are generally more aggressive than sellers when an ascending triangle is present and each attempt made to pull back will stop at earlier stages.
Symmetrical Triangle
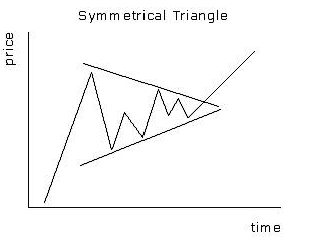
Also referred to as a coil, usually forms during a trend as a continuation pattern. It contains at least two lower highs and two higher lows. At the time these points are conjoined, the lines converge as they are extended and the symmetrical triangle takes shape. One can also think of it as a contracting wedge, wide at the beginning and narrowing over time.
Ascending Triangle
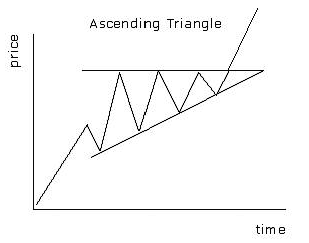
Ascending Triangles is a bullish continuation pattern that is shaped like a right triangle consisting of two or more equal highs forming a horizontal line at the top.
Descending Triangle
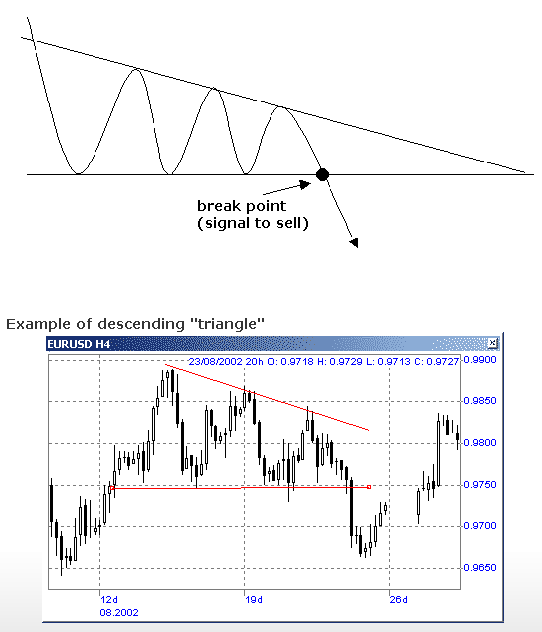
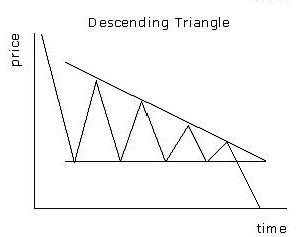
Descending Triangles is a bearish continuation pattern indicating distribution consisting of two or more comparable lows forming a horizontal line at the bottom. Descending triangles are bearish patterns that indicate distribution. The definitive bearish signal of a descending triangle is when support on the lower rung of the triangle is broken.
